Introduction
The US-MPJ site has exhibited conflicting trends in ecosystem productivity from 2010 onward. While ED-LiDAR reconstructions indicate stable or rising productivity, both Landsat NDVI and AmeriFlux tower observations (GPP) show a marked decline. This divergence raises a key question: Is rapid, large-scale canopy mortality being missed by traditional models?
To investigate, we developed a lightweight image-based classifier using high-resolution NAIP aerial imagery to directly detect tree mortality. We then analyzed class transitions across time (2014–2022) and validated findings against tower-based GPP observations.
Model Retraining with Updated Labels
We curated a refined labeled dataset of 1500 high-confidence samples across three classes: LIVE, DEAD, BARE. Labeling combined NDVI-based filtering and visual inspection across 5 NAIP years.
For each pixel, we extracted:
- Red, Green, Blue, NIR
- NDVI = (NIR - Red) / (NIR + Red)
Classifier Details
- Model: Random Forest (100 trees)
- Sampling: Stratified 80/20 train-test split
- Balancing: Class weights set to “balanced”
- Accuracy: 0.838
              precision    recall  f1-score   support
       LIVE       0.86      0.81      0.83        31
       DEAD       0.75      0.78      0.77        23
       BARE       0.90      0.95      0.93        20
Temporal Transition Analysis (2014–2022)

For each pair of years, we exhaustively tested 625 spatial drift combinations, and selected the configuration minimizing biologically implausible transitions (e.g., DEAD → BARE)
| Year Pair | Best Drift | Notes |
|---|---|---|
| 2014 → 2016 | (0, 3, 0, 4) | Minor LIVE → DEAD, DEAD → BARE |
| 2016 → 2018 | (0, 3, 0, 2) | Significant DEAD → BARE |
| 2018 → 2020 | (0, 0, 0, 1) | LIVE → LIVE recovery pattern |
| 2020 → 2022 | (0, 1, 0, 0) | BARE plateaued |
Observations
- The 2016–2018 period shows the most pronounced shift toward BARE
- Post-2020 suggests stabilization
Pixel Class Trends Over Time

Confidence Intervals: Based on classifier precision (LIVE: 95%, DEAD: 62%, BARE: 87%)
- BARE: Steady increase throughout
- DEAD: Falls after 2018, partial rebound by 2022
- LIVE: Rises until 2020, then declines sharply
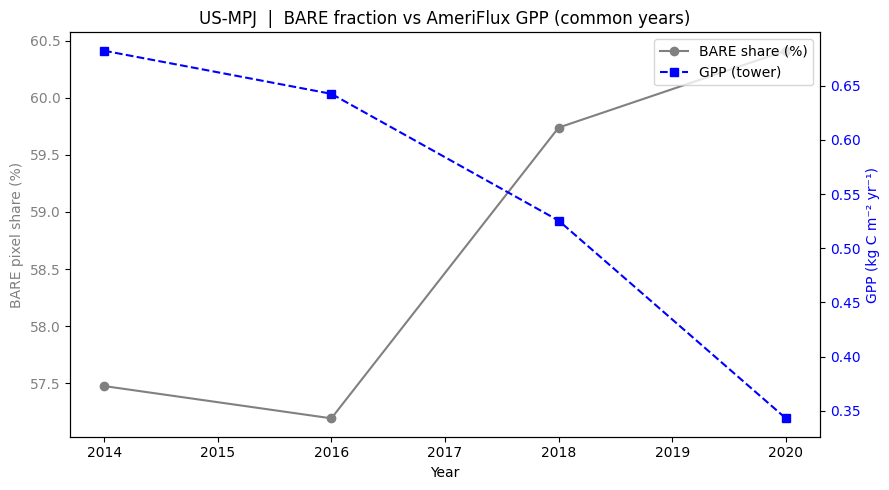
Cross-Validation with AmeriFlux GPP

This analysis is based on AmeriFlux GPP data from the US-MPJ site.
- Spearman ρ = -0.800, p = 0.200 (n = 4)
- Moderate-to-strong negative trend between canopy loss and productivity
Despite small sample size, the directionality supports hypothesis. BARE% rise coincides with sharp GPP fall (2016–2020)
Discussion
- Drift correction improves temporal consistency in pixel-wise transitions
- Model confidence (especially for BARE) lends weight to ecological interpretation
- ED-LiDAR reconstructions likely miss rapid disturbance pulses
Limitations: Spatial resolution mismatch between tower and NAIP raster, small test set; more ground truth would improve model robustness
Conclusion
Our approach demonstrates that lightweight, image-based classifiers can reveal large-scale canopy mortality trends consistent with independent tower and satellite records. These models offer a promising supplement to traditional ecological reconstructions.
Next steps:
- Apply SIFT for more complex transition matching
- Validate with 2022 AmeriFlux GPP
- Package the tool for broader deployment in mortality monitoring
Refer here for all research reports.