Introduction
- Goal: Understand vegetation change and mortality around the US-MPJ flux tower
- Motivation: Prior studies used a simple radial extraction (e.g. 200 m radius) to link predicted tree class maps to tower fluxes like GPP
- Limitation: This radial assumption ignores atmospheric fetch directionality and influence distribution
Limitations of Simple Radial Analysis
- The original 200 m circular masks assume isotropic contribution from surrounding pixels
- GPP (Gross Primary Productivity) measured by eddy covariance towers is influenced by a non-uniform footprint
- This led us to revisit the approach using physical footprint modeling
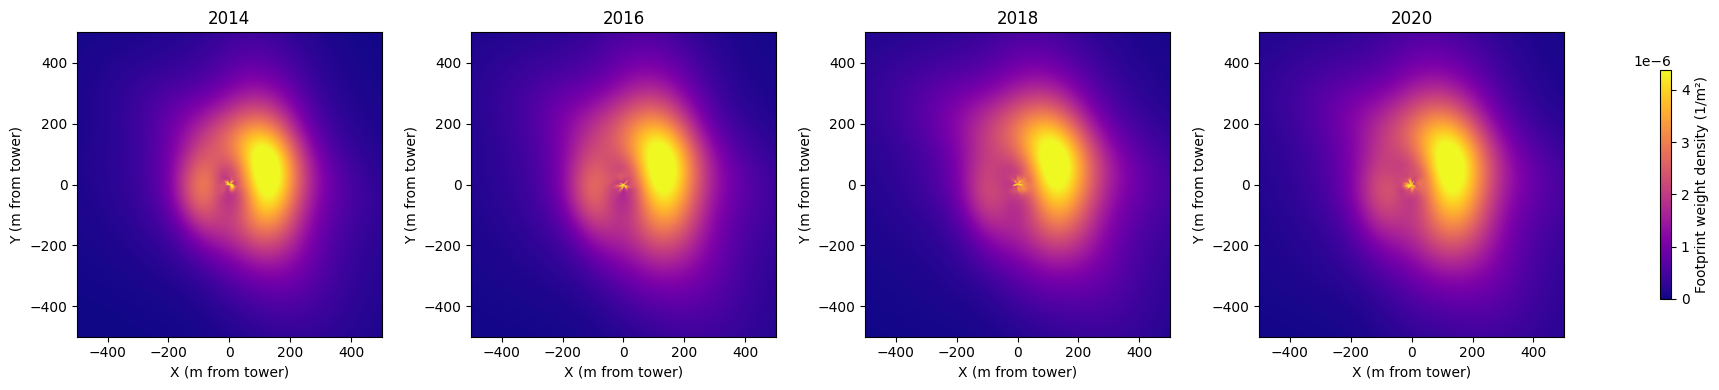
Fetch-Weighted Modeling Approach
Our approach utilizes half-hourly Ameriflux tower meteorology data, including wind speed (WS), wind direction (WD), friction velocity (USTAR), measurement height (zm), roughness length (z0), and canopy height (h).
For each year of analysis, we first extract all valid half-hourly meteorological records from the tower data. For each individual record, we then compute a 2D footprint using a custom Gaussian spread kernel that accounts for atmospheric dispersion patterns.
Finally, we accumulate and normalize these individual footprints across all valid records to produce an annual influence map \(W\) that represents the spatial distribution of tower measurement sensitivity.
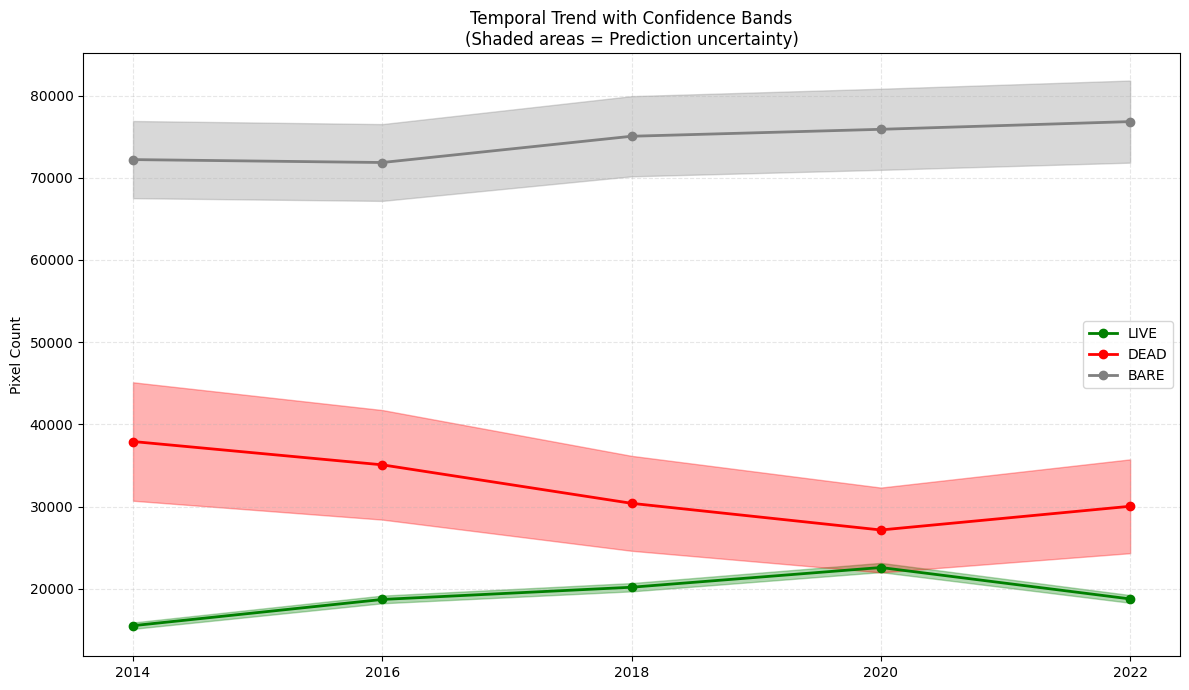
Fetch-Weighted Class Composition Trends
For each year, we projected the annual footprint weight map \(W\) onto the corresponding prediction raster (classes: LIVE = 0, DEAD = 1, BARE = 2). Each \(W\) was interpolated to match the raster resolution.
We then computed fetch-weighted class fractions using:
\[\text{LIVE}_{\text{weighted}} = \sum_{i}\sum_{j:\,P_{i,j}=0} W_{i,j}\] \[\text{DEAD}_{\text{weighted}} = \sum_{i}\sum_{j:\,P_{i,j}=1} W_{i,j}\] \[\text{BARE}_{\text{weighted}} = \sum_{i}\sum_{j:\,P_{i,j}=2} W_{i,j}\]
Since \(W\) is normalized \((Σ W = 1)\), these directly represent the percent contribution of each class to the tower’s GPP footprint.
Confidence intervals were derived using model precision:
- LIVE: 95%
- DEAD: 62%
- BARE: 87%
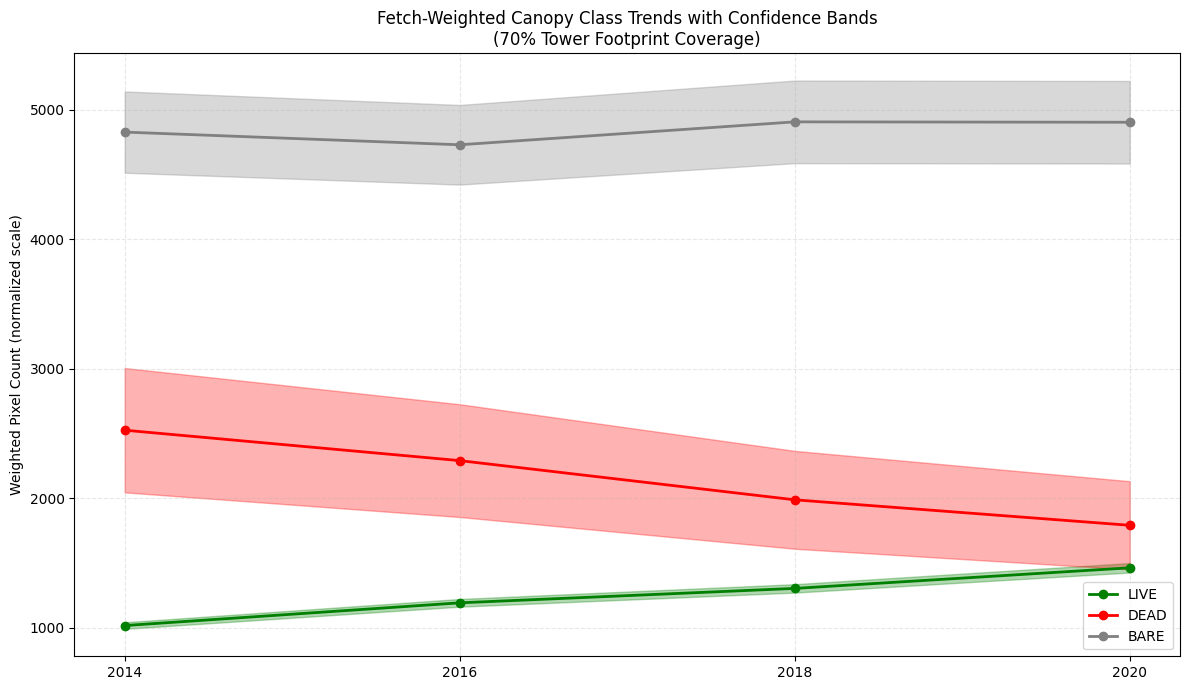
The fetch-weighted analysis reveals a more pronounced decline in DEAD class composition and demonstrates greater stability in BARE class trends compared to the simple radial approach.
Understanding Activation: Weight Distribution
The distribution of footprint weights \(W\) is extremely skewed. While the full raster may span up to 1 km², only a small fraction of pixels meaningfully influence the tower signal. Most pixels have weights near zero.
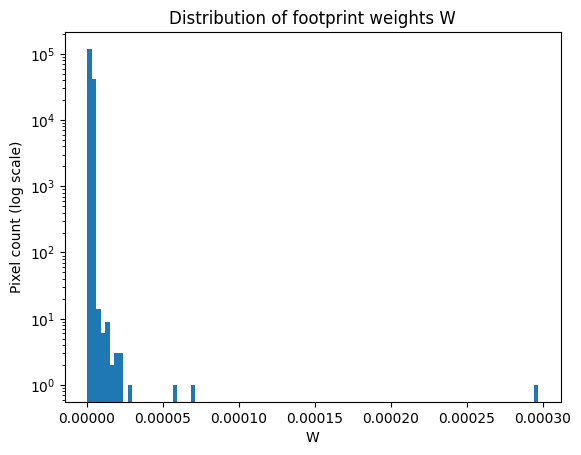
This confirms that fetch-based analysis is fundamentally different from circular masking. A 200 m radius includes thousands of irrelevant pixels, whereas fetch weighting highlights only the core contributing region.
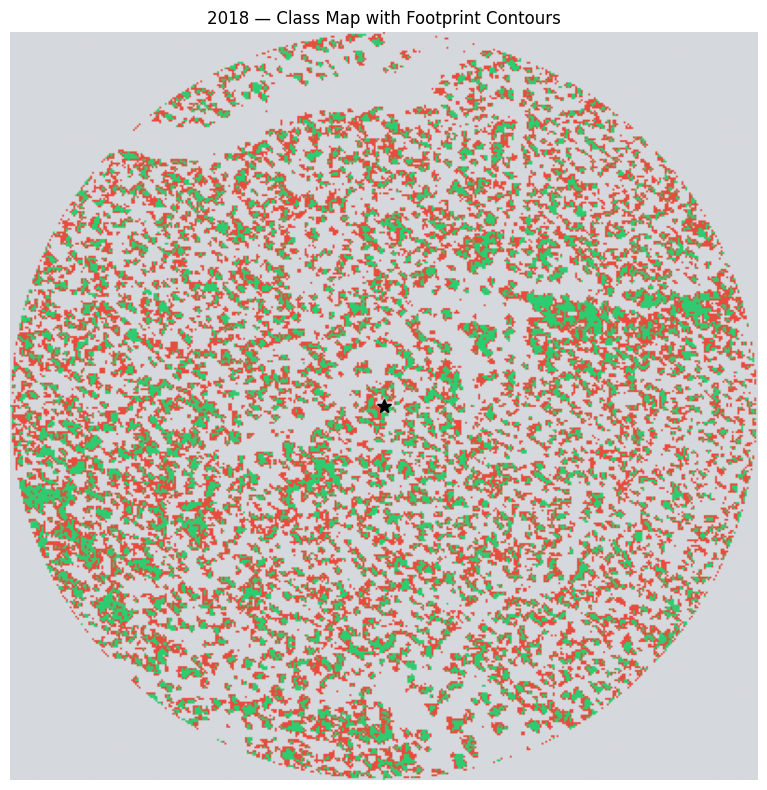
Visualizing Activation Regions
- Overlaid high-weight contours on prediction maps to reveal where influence was concentrated
- Only a small fraction of pixels within the 200 m zone carried meaningful weight
Next Steps
- Expand analysis to a 1 km² area
- Integrate higher-frequency (HH) Ameriflux data to refine temporal precision
- Combine annual footprints with seasonal GPP partitions
- Use cumulative multi-year fetch to study legacy effects
- Run per-class NDVI or canopy height trends within weighted zone
Refer here for all research reports.